COVID-19
Herd Immunity Re-Revisited
3. Calculate the costs.
Before building a tower, one should estimate the costs and see if it is worth to be completed.
3.1. Excess mortality.
The highly transmissible Omicron coronavirus variant has been associated with millions of hospitalizations, including a larger proportion of children than with previous variants.
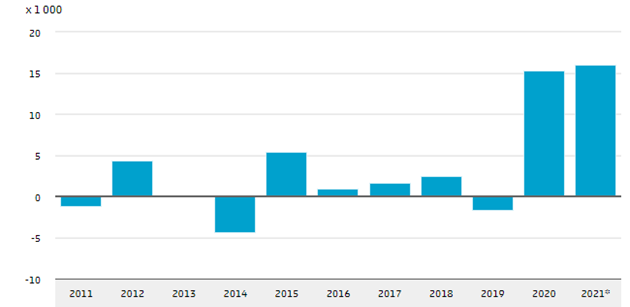
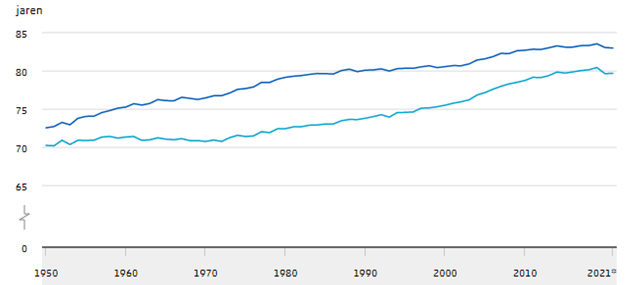
The COVID-19 epidemics reduced life expectancy and cause excess mortality. The Dutch excess mortality was 15,000 and 16,000 in 2020 and 2021, respectively, 9 to 11 % of the expected 155.000 fatalities. Excess mortality was slightly higher in males than in females, as expected from covid-related fatality rates. The excess mortalities of 2020 and 2021 resulted in a decreased average life expectancy to 83.0 years for females and 79.7 for males.
After the excess mortality waves due to influenza e.g., in 2015 and 2018, a period of decreased mortality followed these waves (Statistics Netherlands). This decrease mortality was missing in 2020 and 2021, indicating that fatal cases due to COVID-19 are not often people with a very short life expectancy. Moreover, the excess mortality during the flu epidemics was never so high (Figure 4). During SARS-2 excess mortality resulted in a decrease in life expectancy, not observed for at least 50 years (Figure 5).
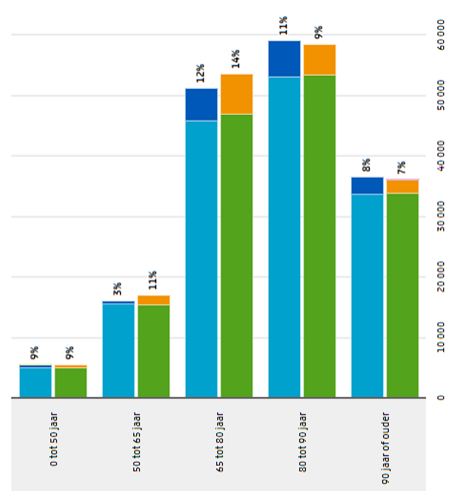
More people died than expected in all age groups (Figure 6). Excess mortality was 9% in the population under 50 years old, indicating that SARS-2 is a significant cause of death in younger people. The relative excess mortality was highest among people aged 65 to 80 years old at 14%.
Figure 4. Excess mortality data from the Netherlands. Asterisk indicates provisional data for 2021.
Figure 5. Average life expectancy in years at birth for females (dark blue) and males (light blue). Asterisk indicates provisional data for 2021.
Figure 6. Excess mortality by age group. Blue is mortality in 2020 with dark blue indicating excess mortality. Green/orange are provisional data for 2021, orange is the excess mortality. The percentages are the relative contribution of excess mortality.
3.2. Acute impact
Like in most virus infections, only a minority of people will fall ill, but severe and lethal COVID-19 also occur. Serious disease course is more often in the elderly, males, and people with comorbidities like immune suppression or cardiovascular risks, see U-Prevent to calculate your risk. However also in healthy young people the disease can be very serious e.g., a putative lethal immune overactivation sometimes referred to as cytokine-release syndrome, high fever, severe pneumonia, or multi-system inflammatory syndrome in children and adolescents (MIS-C). This acute impact could also result in damage in various organs or diabetes.
3.3. Hidden impact
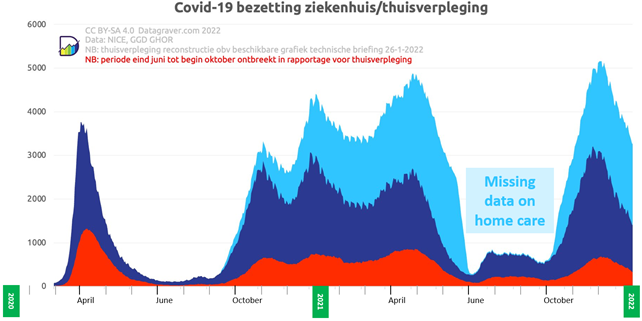
Striving for herd immunity leads to many hospitalizations, deaths and long covid cases. Not all governments like the idea that they protect their civilians insufficiently. The Dutch government likes to illustrate that the disease burden of COVID19 decreased and the RIVM numbers on hospitalization are very suitable for this aim. However, these data distort the picture, since the Netherlands have raised the level of triage, and many people are left at home, sometimes having oxygen supply in home care. Only correcting for the homecare illustrates that the maximum number of specialized medical care is still increasing in every wave (Figure 7).
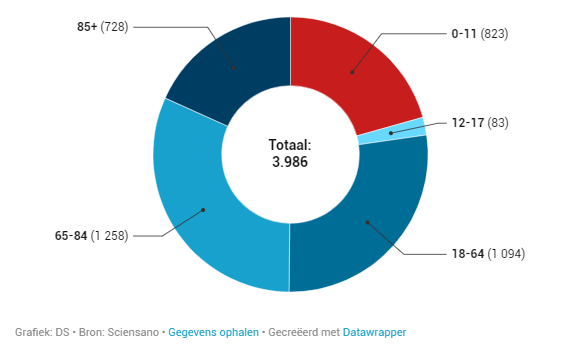
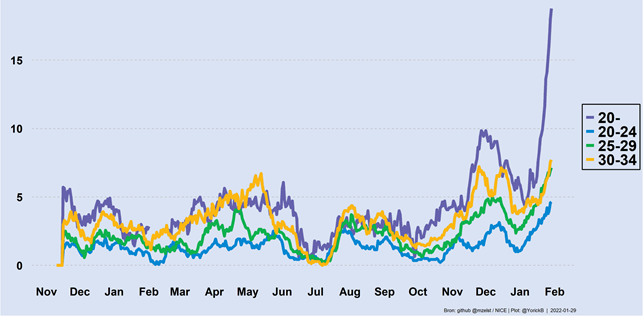
Data from Belgium (Figure 8) and the Netherlands (Figure 9) shows that Omicron has caused significant numbers of hospitalizations in young people and children due to COVID-19. About 0.8% of the Belgian children under 11 years old needed hospitalizations due to a SARS-2 infection. Although children with comorbidities have higher risks of hospitalizations, 80% of the hospitalized children had no comorbidities, illustrating that everyone is at risk for serious disease. Unfortunately, no clear data from the Netherlands are available. Similar data were observed in South Africa, the USA, and the UK. Vaccination would also protect children from COVID-19.
Data from Belgium (Figure 8) and the Netherlands (Figure 9) shows that Omicron has caused significant numbers of hospitalizations in young people and children due to COVID-19. About 0.8% of the Belgian children under 11 years old needed hospitalizations due to a SARS-2 infection. Although children with comorbidities have higher risks of hospitalizations, 80% of the hospitalized children had no comorbidities, illustrating that everyone is at risk for serious disease. Unfortunately, no clear data from the Netherlands are available. Similar data were observed in South Africa, the USA, and the UK. Vaccination would also protect children from COVID-19.
Figure 7. People admitted to IC (red) hospital (dark blue), or home care with oxygen (light blue) in the Netherlands
Figure 8. COVID-19 hospitalization by age groups in Belgium.
Figure 9. COVID-19 hospitalization rates by age groups in the Netherlands.
3.4 Delayed impact
Delayed impact after SARS-2 infection is often referred to as long covid, which is a collection of diseases that occur after acute SARS-2 infection. Because of the wide range of diseases, I prefer to refer to refer to the collection as long covid, leaving differential naming strategies for several syndromes that will be distinguishable by scientific programs like COVID extension of P4O2. These pathologies stretch well beyond traditional post-viral infection syndromes and include:
- Dysregulation of innate antiviral immunity of of type 1 interferons.
- Infection antigen specific B- and T-cells and inhibition of antibody affinity maturation in B-cells.
- Immune overactivation by superantigen activity causing severe disease or triggering immune suppression as feedback.
- Persistent virus infection with chronic superantigen-induced immune activation.
- Damage on small pulmonary blood vessels causing long-term undersaturation of blood oxygen.
- Loss of taste and smell due to brain infection
- Brain fog due to (brain) infection and damage.
- Early stages of brain diseases e.g., multiple sclerosis and Parkinson’s disease
- Reactivation of EBV infections.
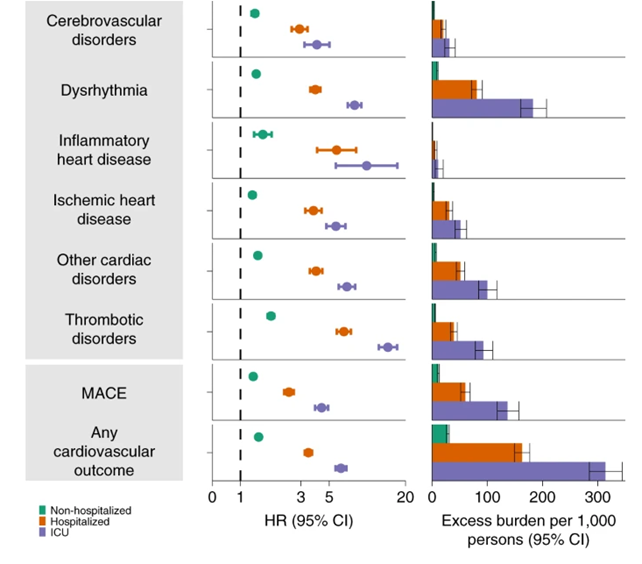
- Cardiovascular disease with delayed mortality (Figure 10). In the Netherlands, 10% and 20% more reanimations have been performed in 2020 and 2021, respectively, compared to 2019.
- Prolong tiredness.
- In a subset of long covid patients, the complaints still increase after three months, indicating that it will not always resolve quickly.
Figure 10. Relative risks and absolute burden after 12-month post-acute COVID-19
3.5. Secret impact
Vulnerable people are not stupid, if the government does not protect them, they will try to protect themselves. If society does not keep the number of infections low, they will withdraw themselves from society. Some people have been already isolated from society for two years. The social impact of this can hardly be underestimated. Others will limit their behavioural change to avoiding large groups with increased risks of infections.
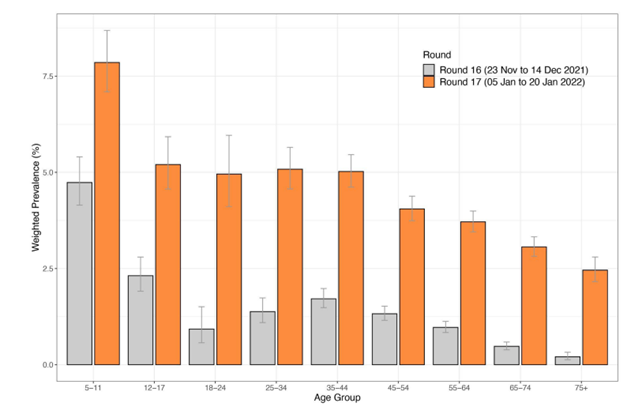
Government policies aim to spread the virus in low-risk groups, like young children. It offers no advantage to the children but only some risks since also for them it is not safe to become infected. Recent data from Omicron show that new infections enter the populations through the youngest children. The elderly people might be the last to become infected (Figure 11). Some jobs, like health care workers and teachers, become very risky in times of the epidemic due to their frequent contact with infected people. It is conceivable that some people will make different career choices from health perspective.
Government policies aim to spread the virus in low-risk groups, like young children. It offers no advantage to the children but only some risks since also for them it is not safe to become infected. Recent data from Omicron show that new infections enter the populations through the youngest children. The elderly people might be the last to become infected (Figure 11). Some jobs, like health care workers and teachers, become very risky in times of the epidemic due to their frequent contact with infected people. It is conceivable that some people will make different career choices from health perspective.
Figure 11. Relative infections in various age groups by Omicron in two different periods. Data from UK.
John. J.L. Jacobs. 18.02.2022
